Design a Schema for the App
In this section, you’ll start designing the schema of the message board app and look at how graph schemas and graph queries work.
To design the schema, you won’t think in terms of tables or joins or documents, you’ll think in terms of entities in your app and how they are linked to make a graph. Any requirements or design analysis needs iteration and thinking from a number of perspectives, so you’ll work through some of that process and sketch out where you are going.
Graphs tend to model domains like your app really nicely because they naturally model things like the subgraph of a user, their posts and the comments on those posts, or the network of friends of a user, or the kinds of posts a user tends to like; so you’ll look at how those kinds of graph queries work.
UI requirements
Most apps are more than what you can see on the screen, but UI is what you are focusing on here, and thinking about the UI you want will help to kick-off your design process. So, let’s at start by looking at what you would like to build for your app’s UI
Although a single GraphQL query can save you lots of calls and return you a subgraph of data, a complete page might be built up of blocks that have different data requirements. For example, in a sketch of your app’s UI you can already see these data requirements forming.
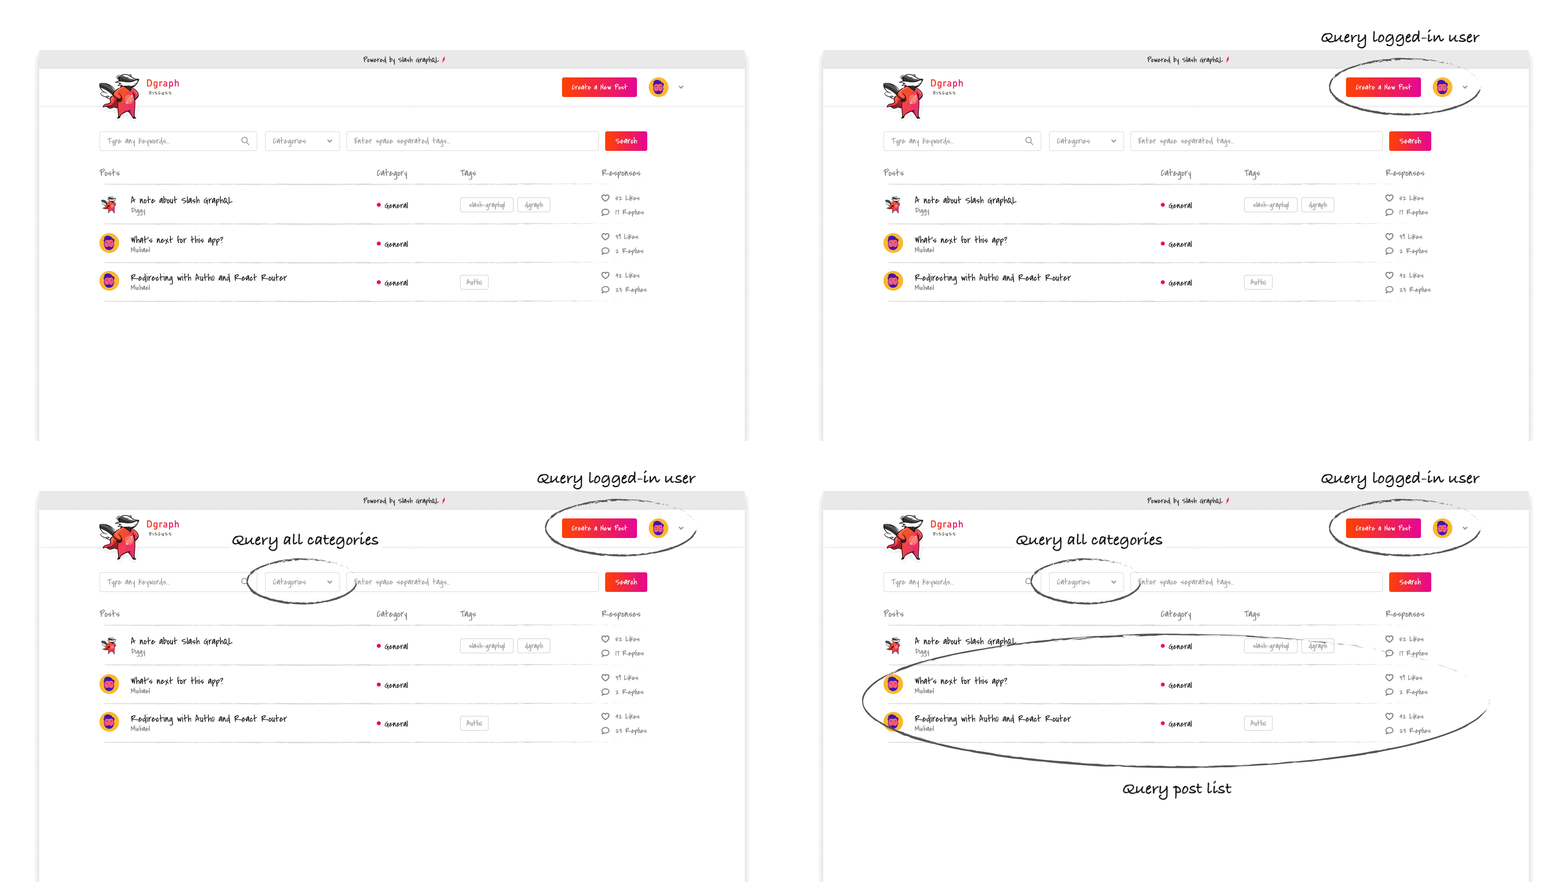
App UI requirements
You can start to see the building blocks of the UI and some of the entities (users, categories and posts) that will form the data in your app.
Thinking in Graphs
Designing a graph schema is about designing the things, or entities, that will form nodes in the graph, and designing the shape of the graph, or what links those entities have to other entities.
There’s really two concepts in play here. One is the data itself, often called the application data graph. The other is the schema, which is itself graph shaped but really forms the pattern for the data graph. You can think of the difference as somewhat similar to objects (or data structure definitions) versus instances in a program, or a relational database schema versus rows of actual data.
Already you can start to tease out what some of the types of data and relationships in your graph are. There’s users who post posts, so you know there’s a relationship between users and the posts they’ve made. You know the posts are going to be assigned to some set of categories and that each post might have a list of comments posted by users.
So your schema is going to have these kinds of entities and relationships between them.
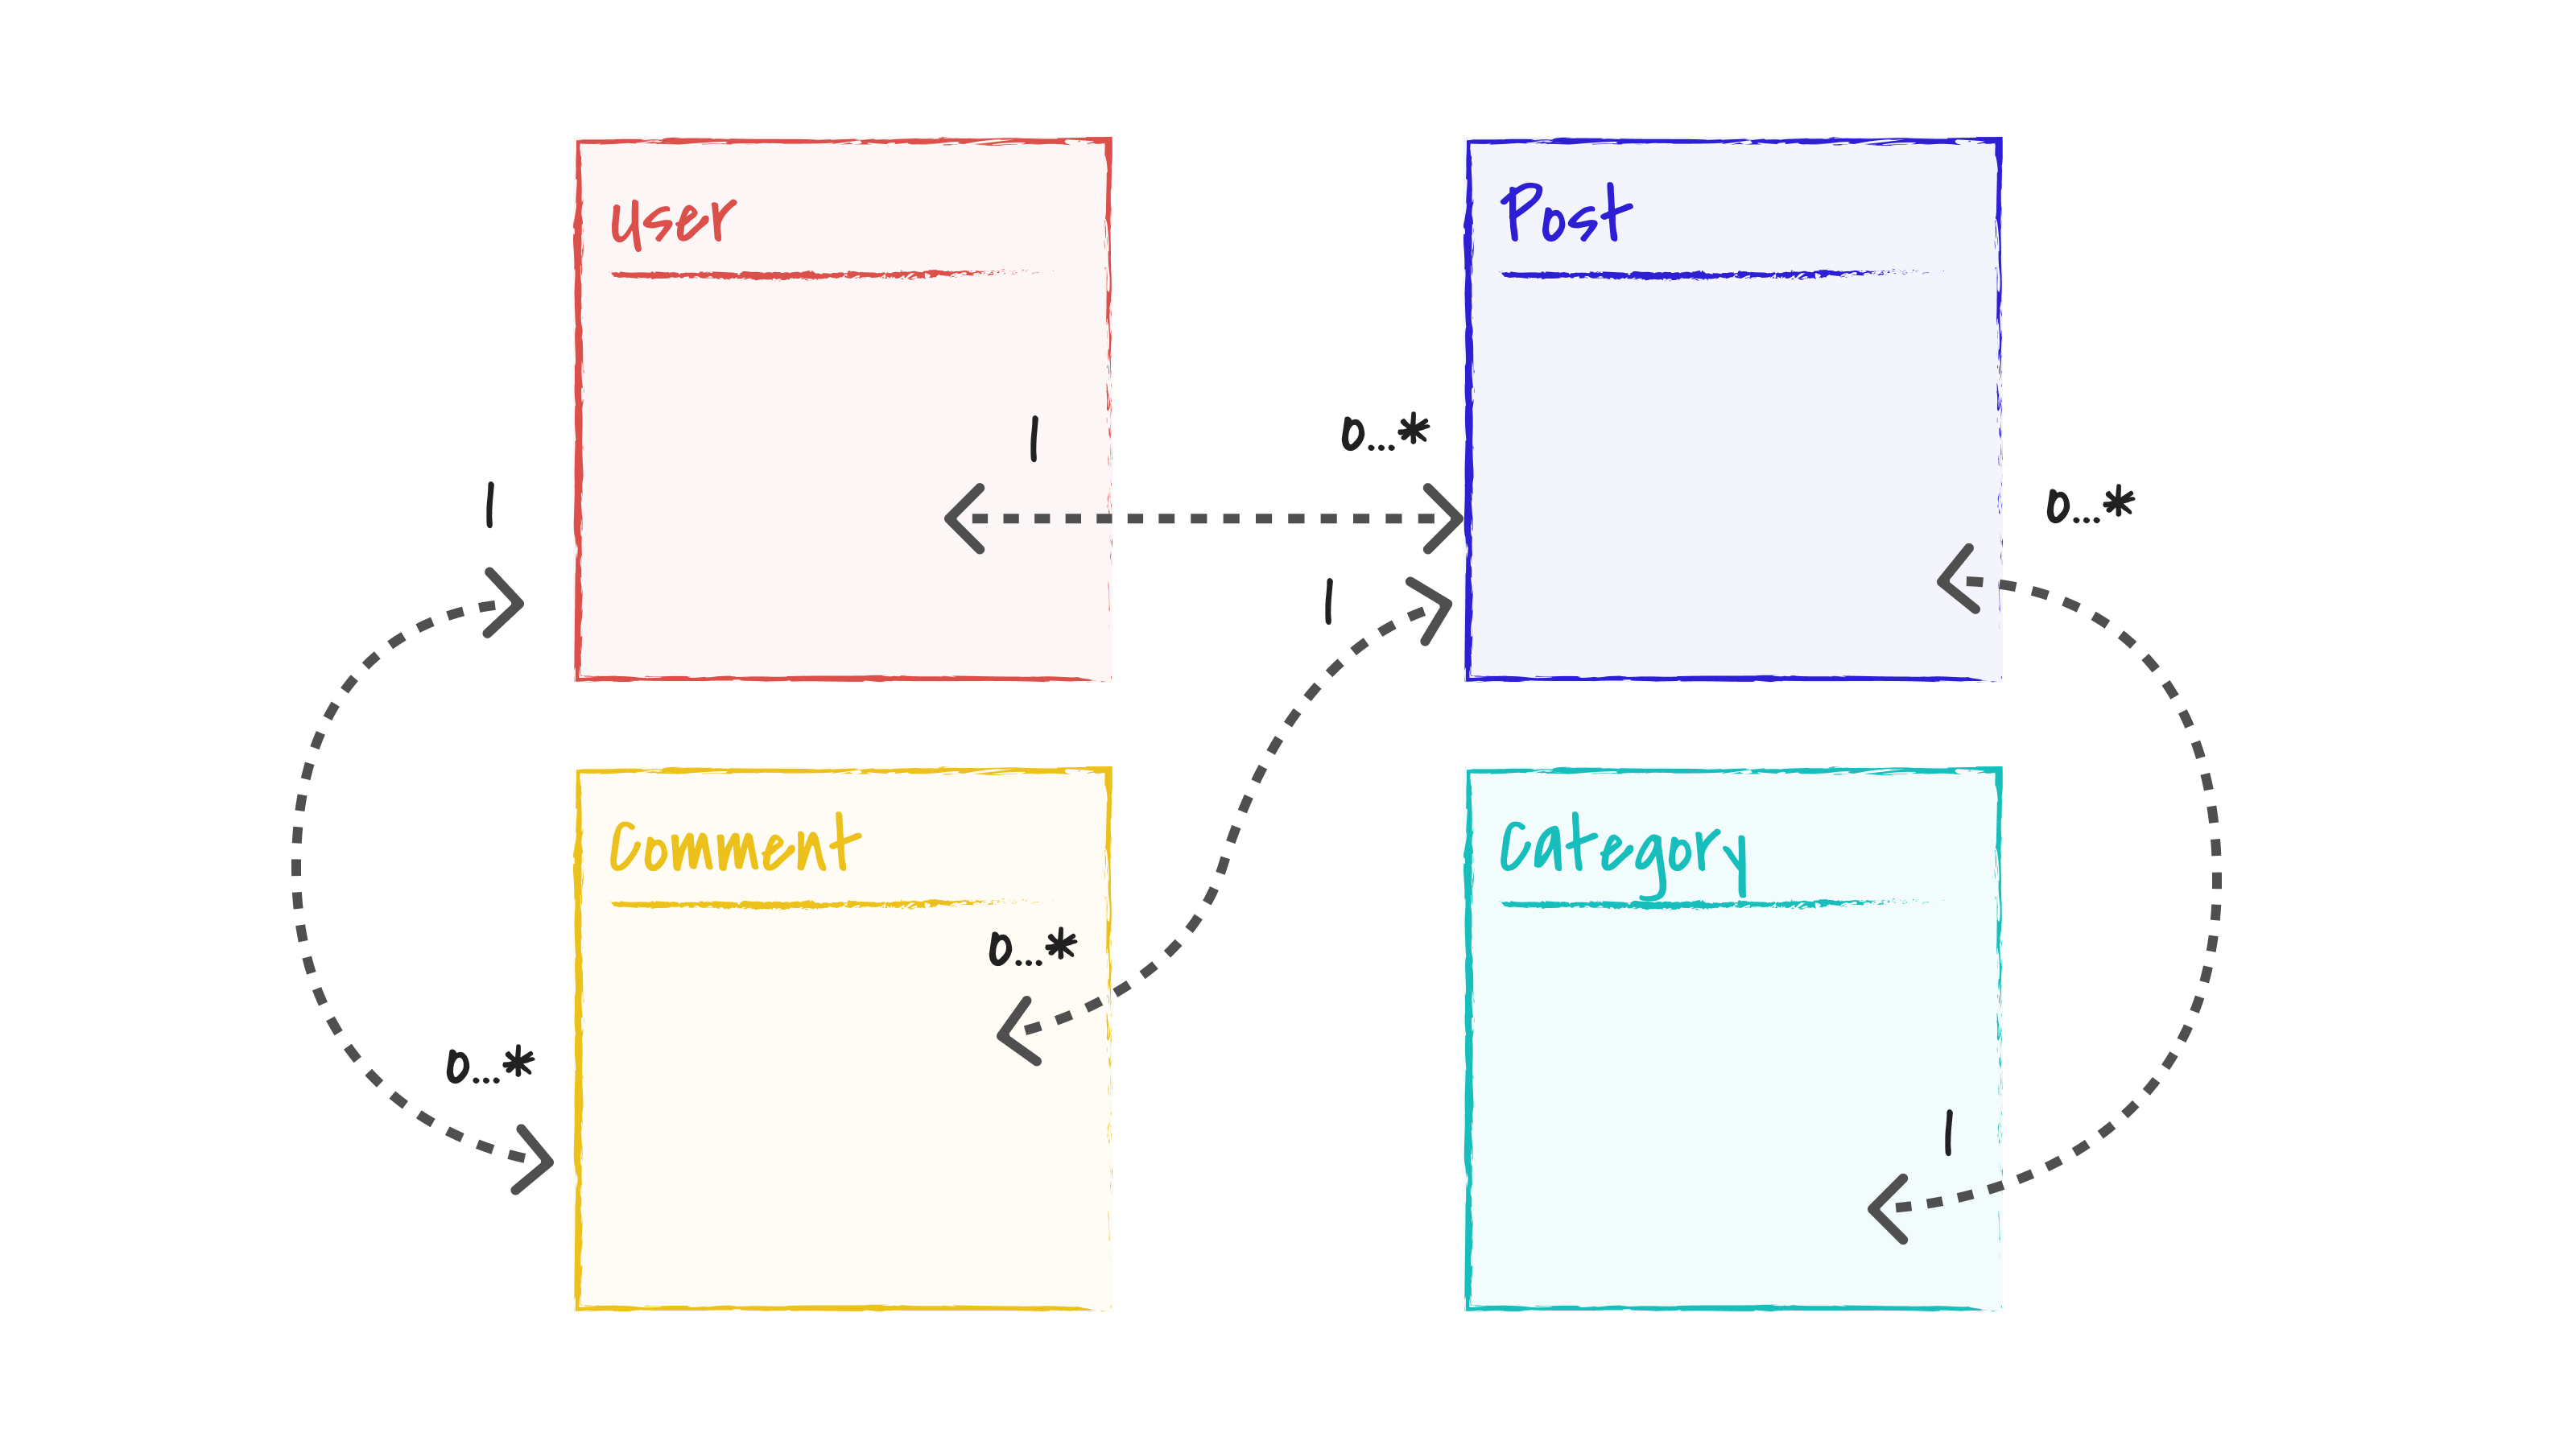
Graph schema sketch
I’ve borrowed some notation from other data modeling patterns here. That’s pretty much the modeling capability GraphQL allows, so let’s start sketching with it for now.
A user is going to have some number of (zero or more 0..*) posts and a post can have exactly one author. A post can be in only a single category, which, in turn, can contain many posts.
How does that translate into the application data graph? Let’s sketch out some examples.
Let’s start with a single user who’s posted three posts into a couple of different categories. Your graph might start looking like this.
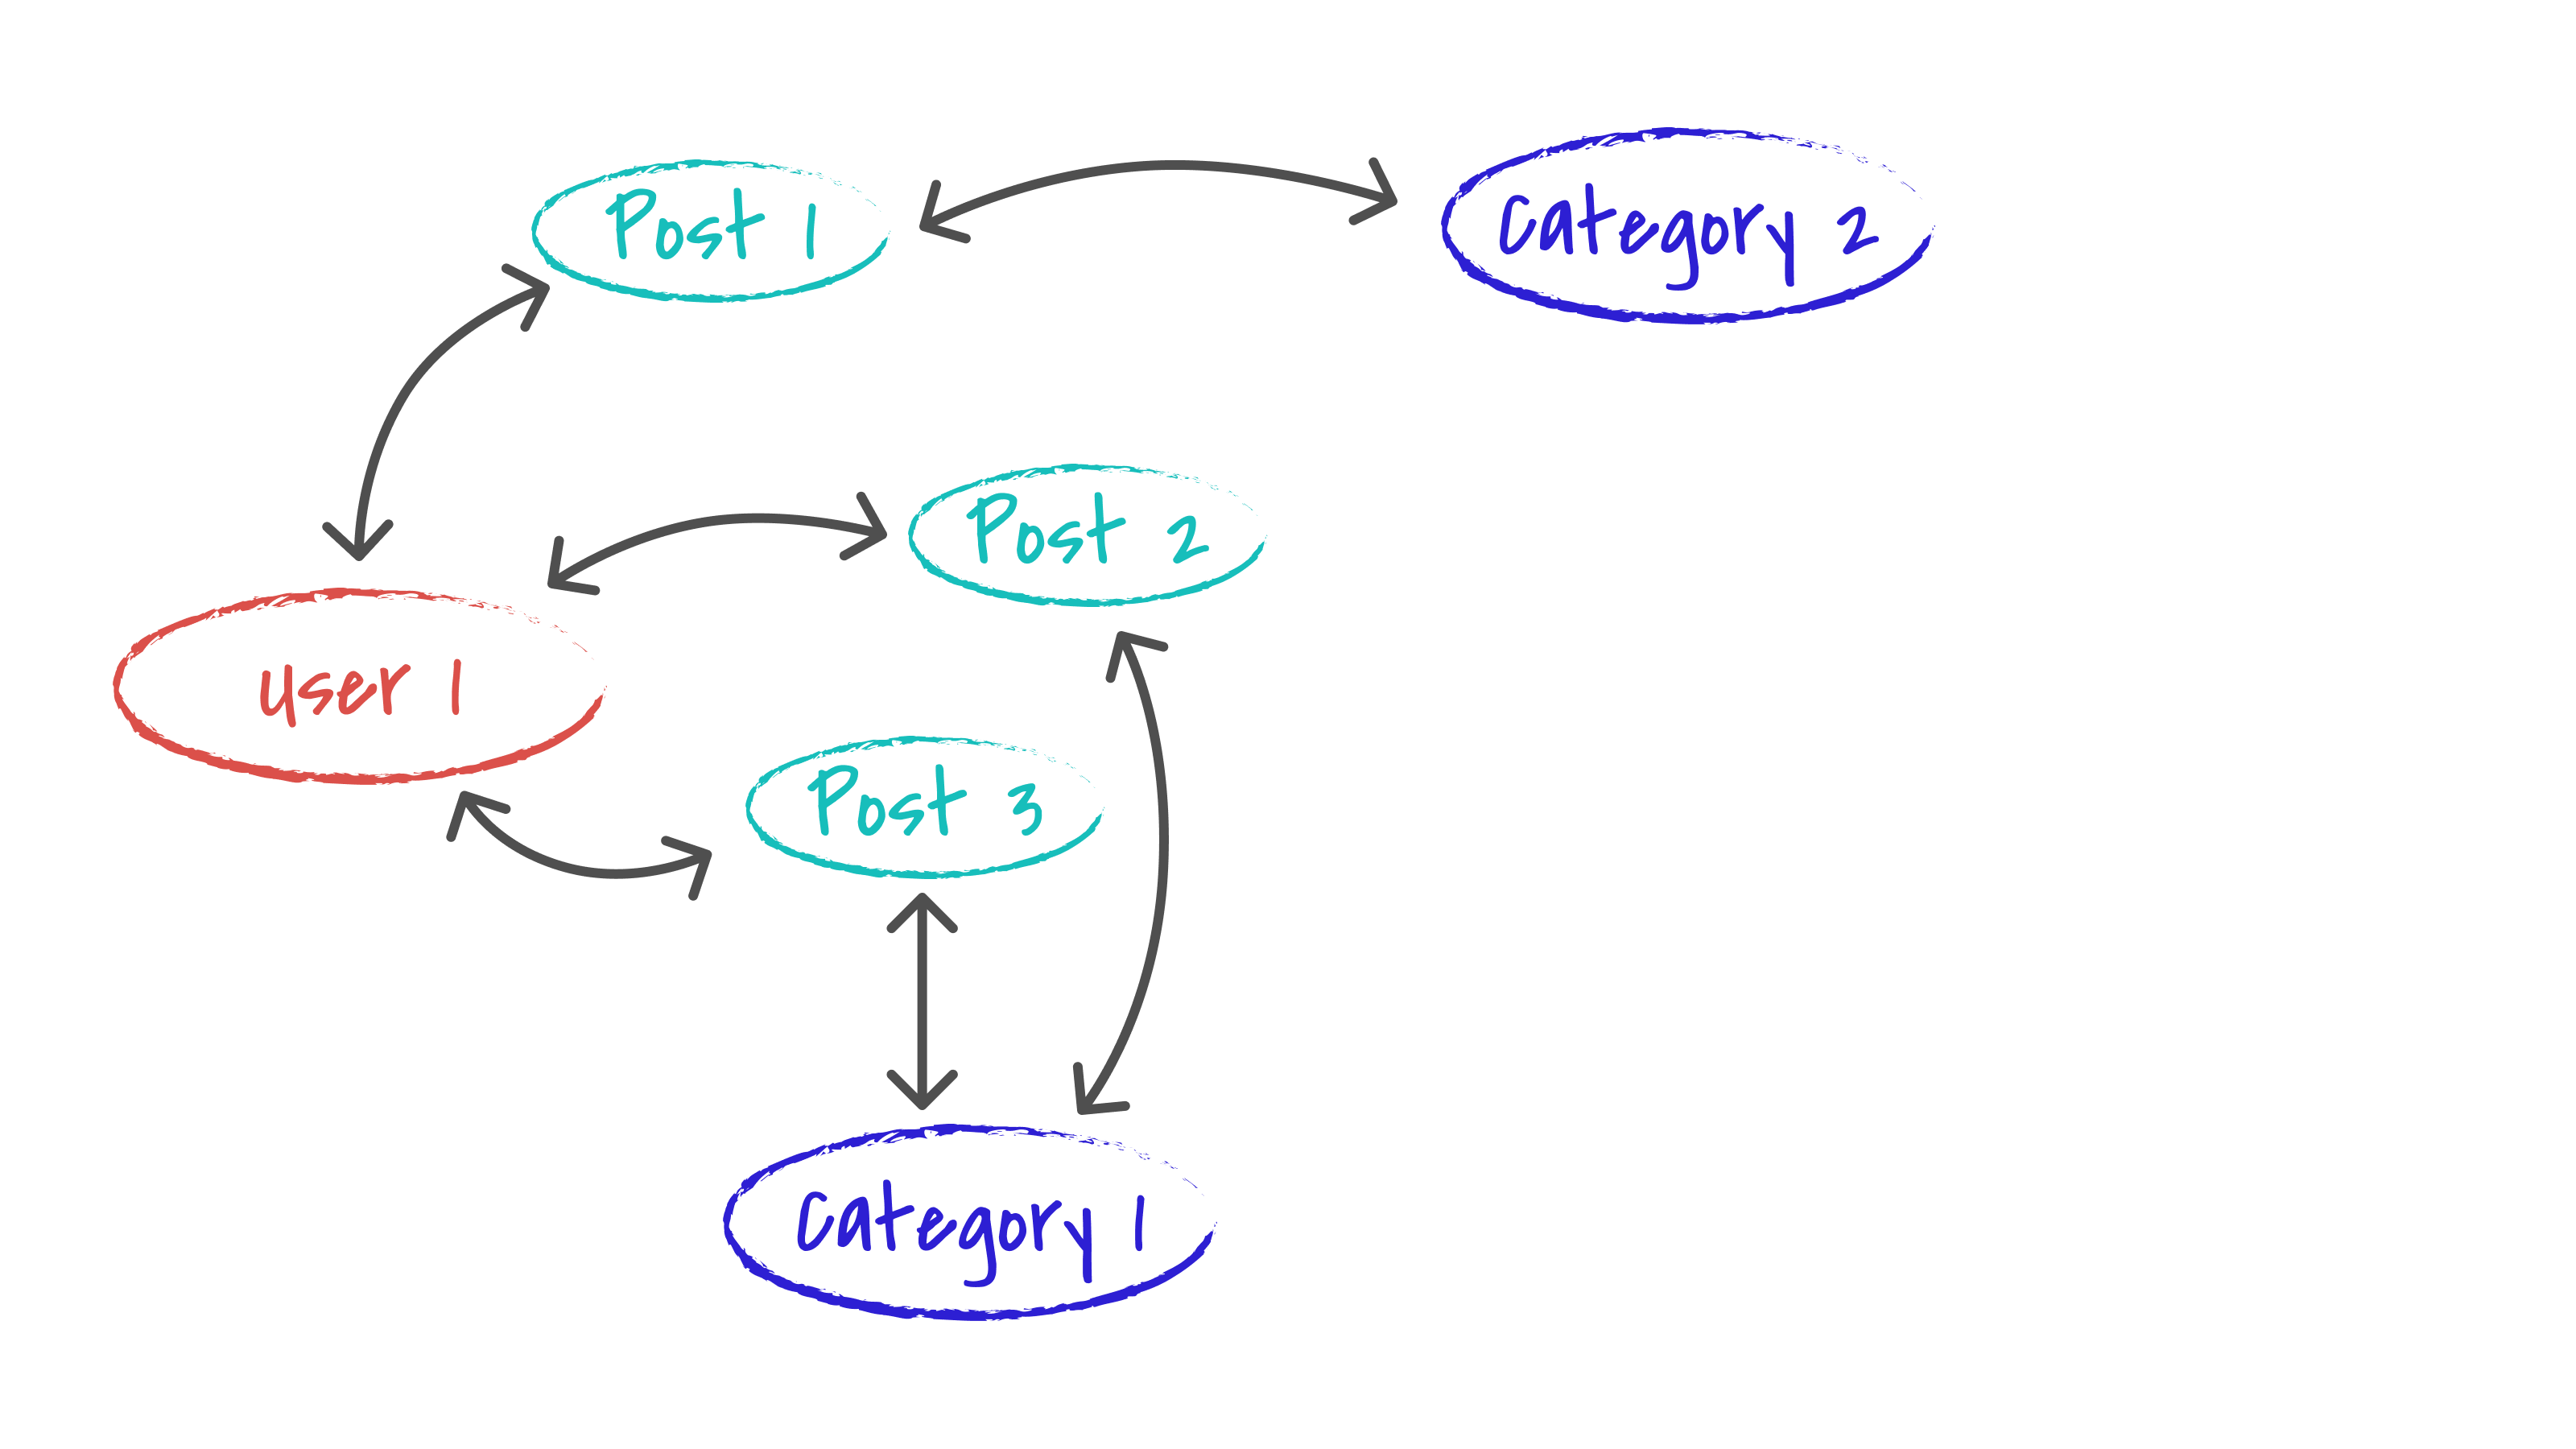
Then another user joins and makes some posts. Your graph gets a bit bigger and more interesting, but the types of things in the graph and the links they can have follow what the schema sets out as the pattern — for example you aren’t linking users to categories.
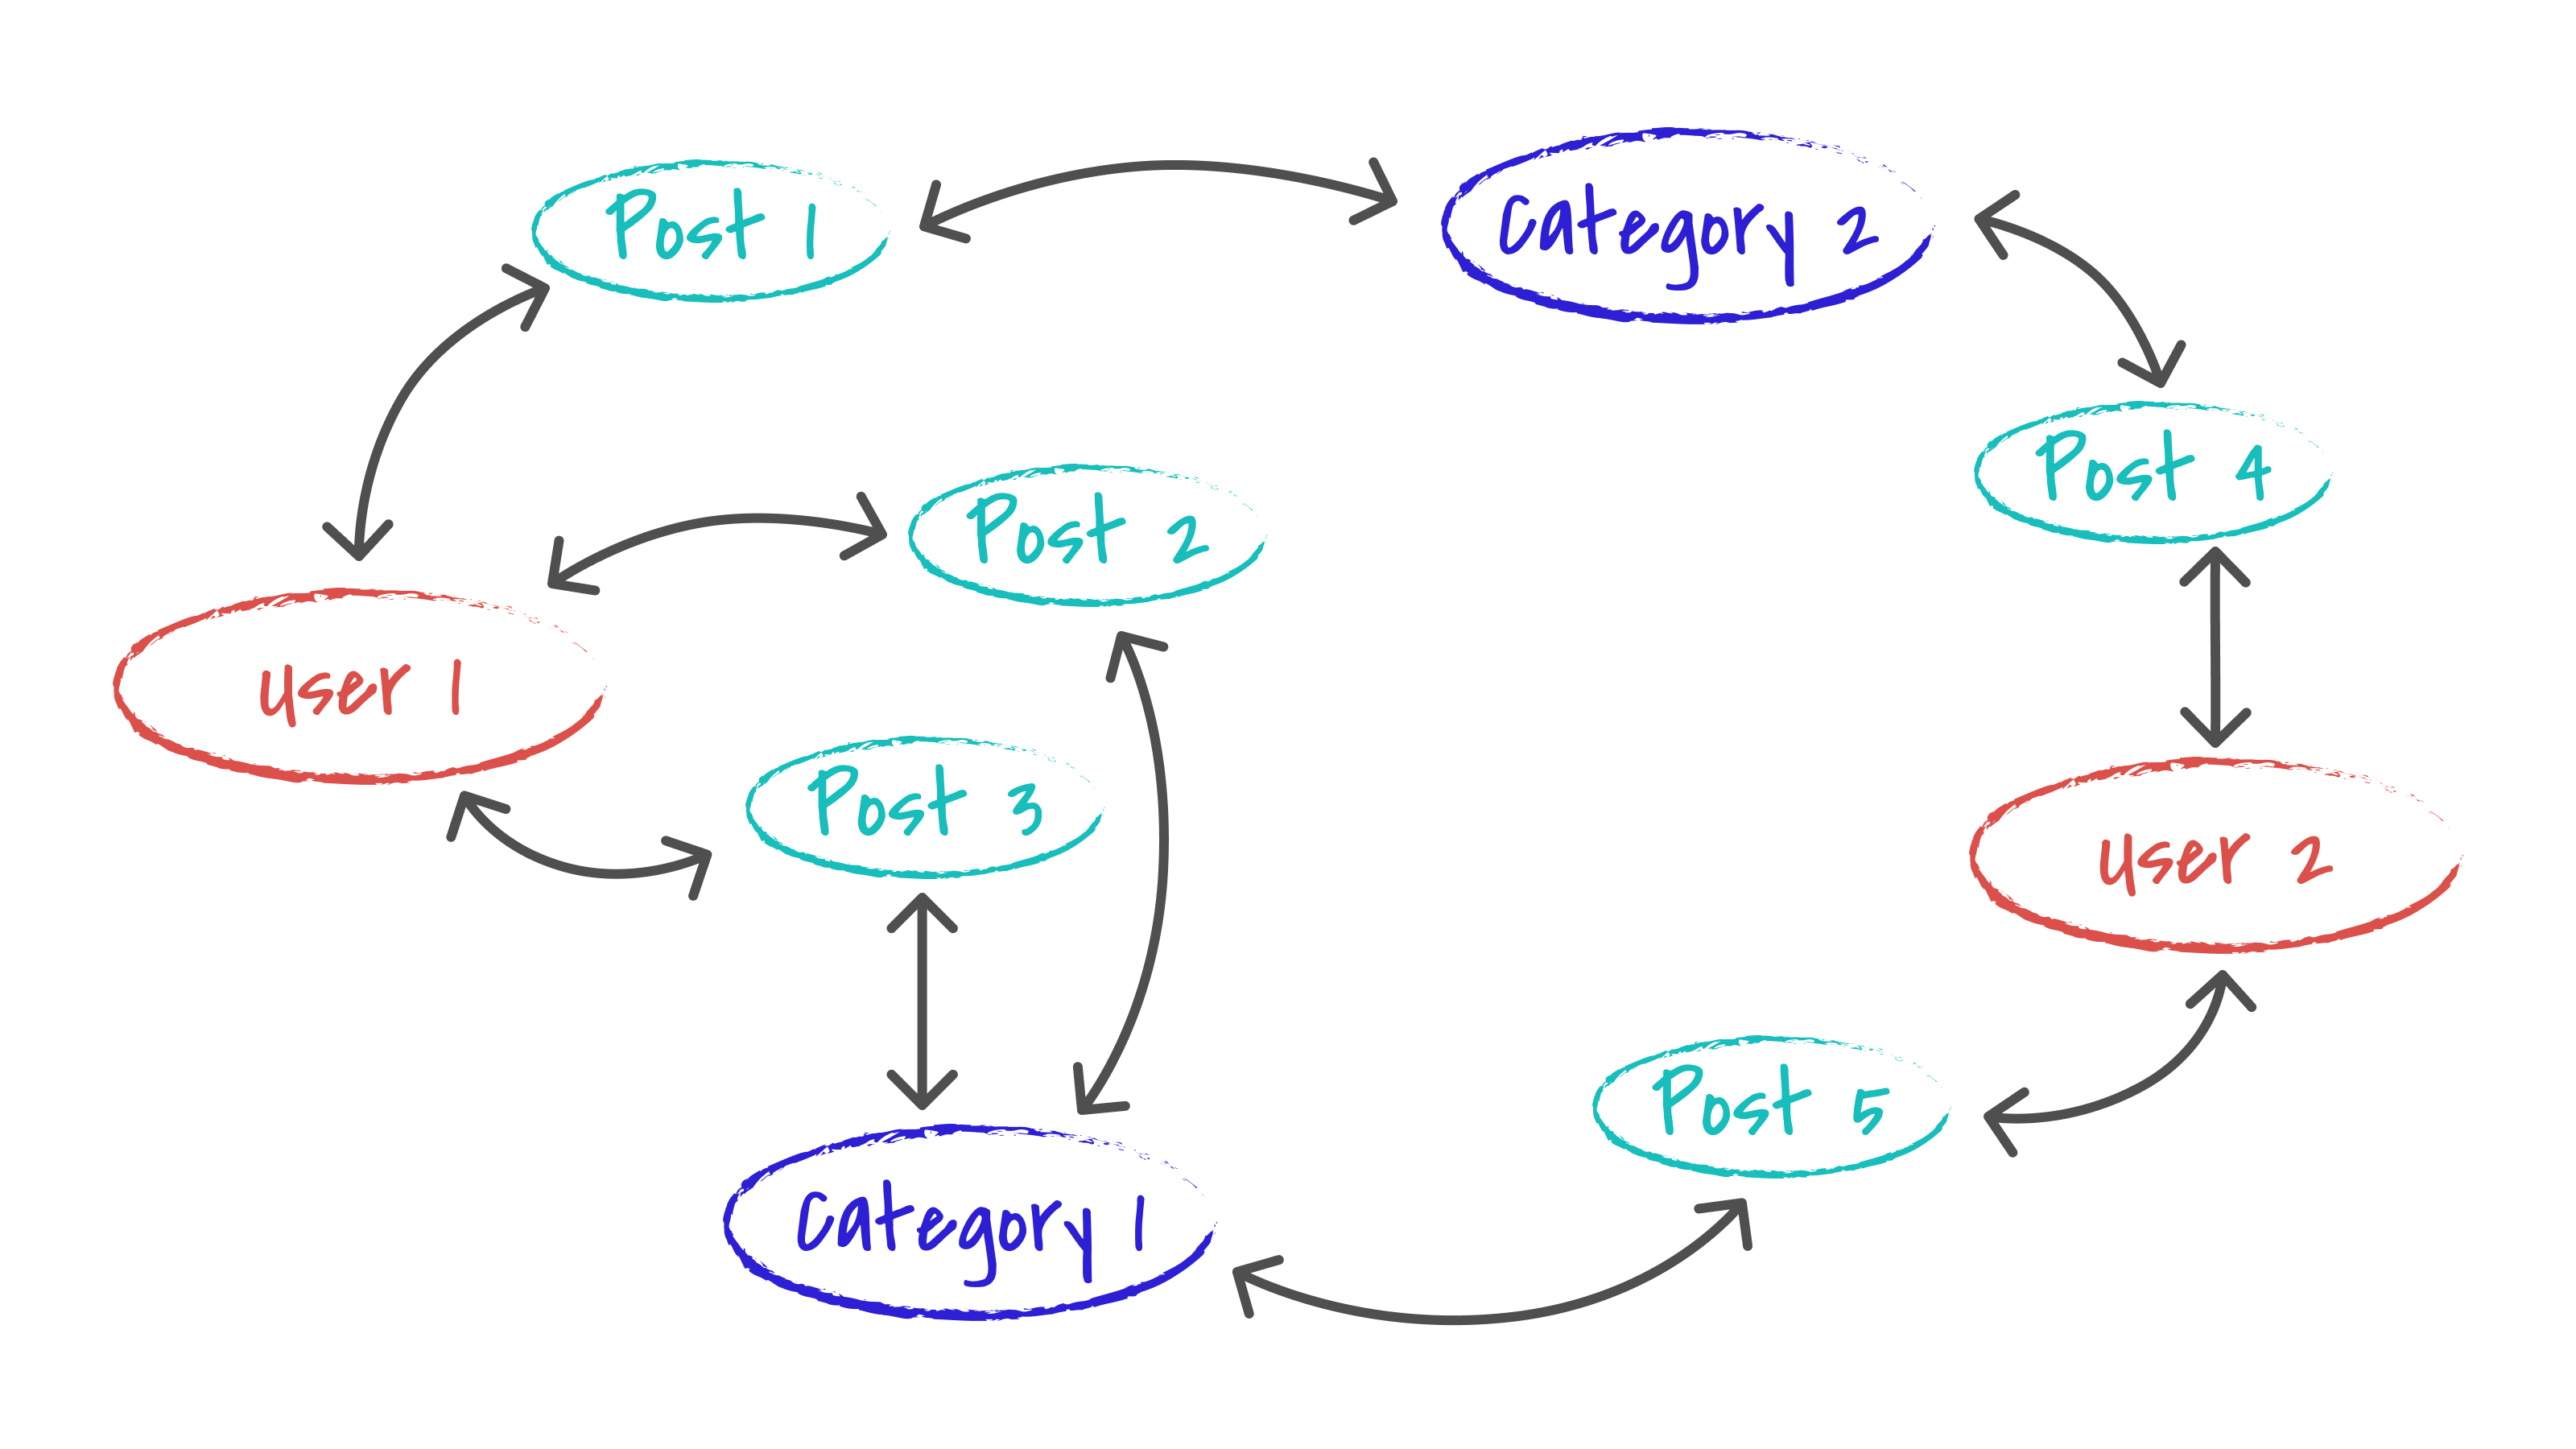
more users and posts
Next the users read some posts and start making and replying to comments.
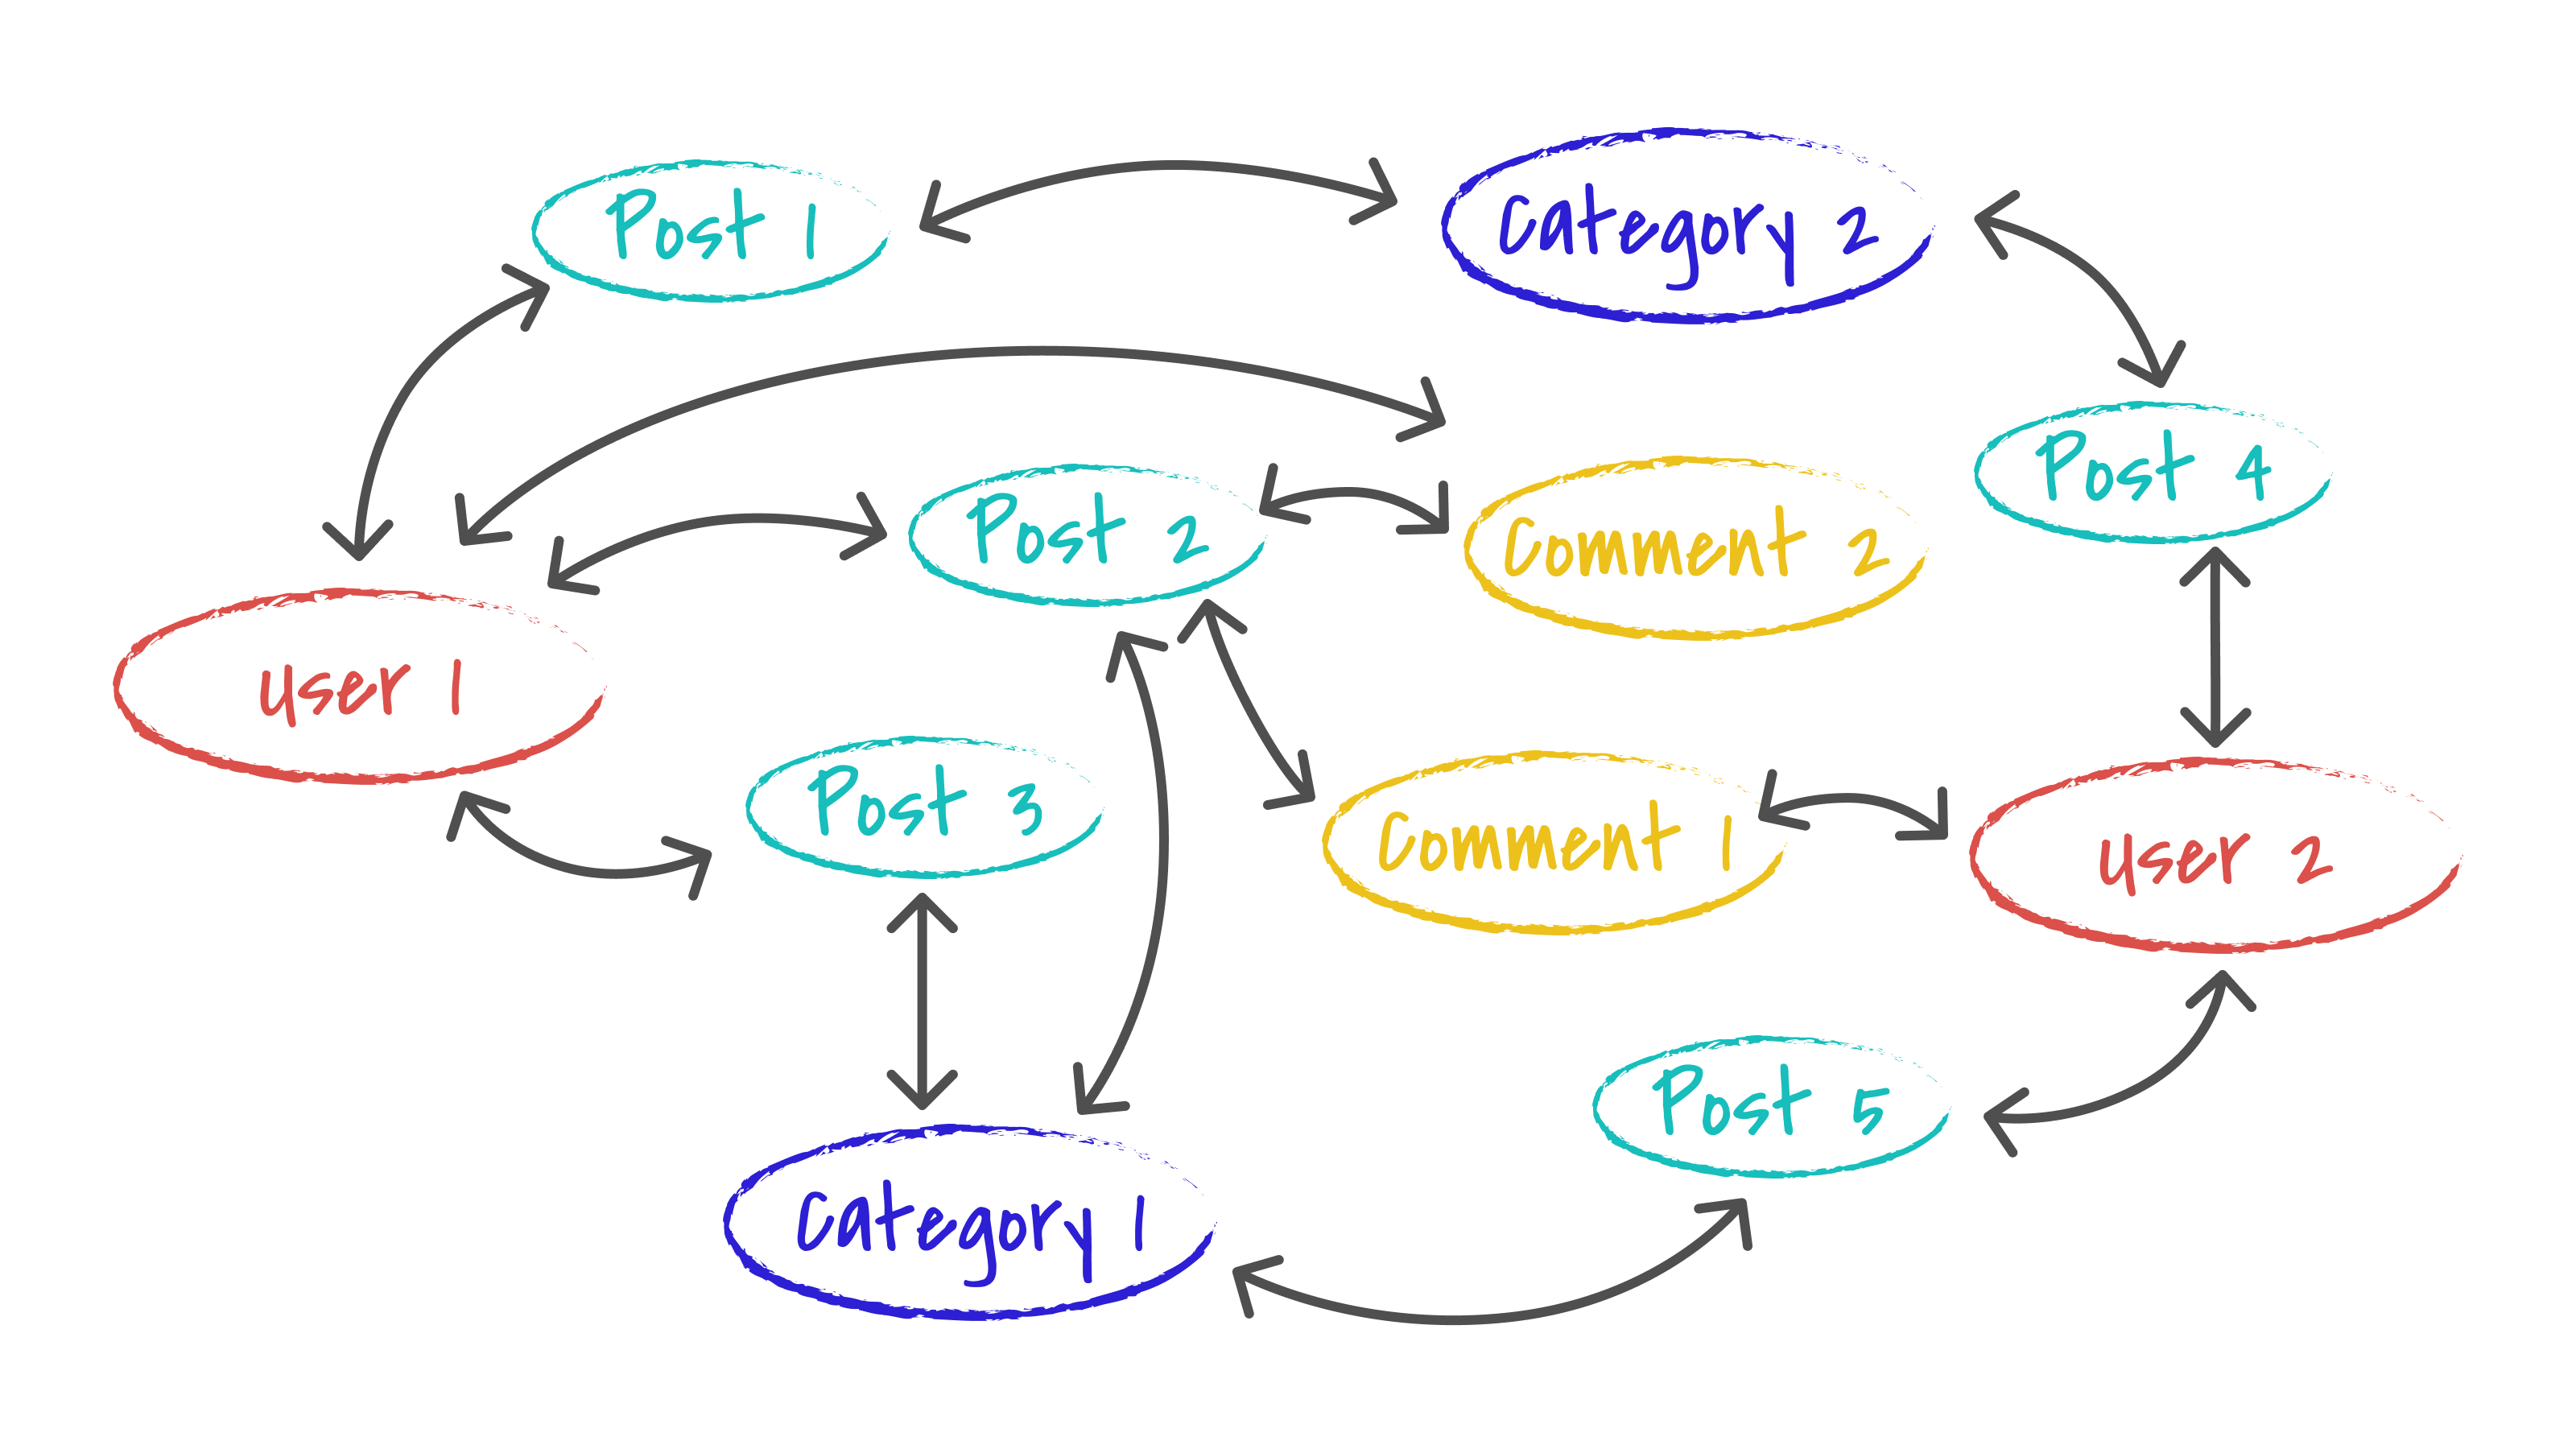
users, posts and comments
Each node in the graph will have the data (a bit like a document) that the schema says it can have, maybe a username for users and title, text and date published for posts, and the links to other nodes (the shape of the graph) as per what the schema allows.
While you are still sketching things out here, let’s take a look at how queries will work.
How graph queries work
Graph queries in GraphQL are really about entry points and traversals. A query picks certain nodes as a starting point and then selects data from the nodes or follows edges to traverse to other nodes.
For example, to render a user’s information, you might need only to find the user. So your use of the graph might be like in the following sketch — you’ll find the user as an entry point into the graph, perhaps from searching users by username, query some of their data, but not traverse any further.
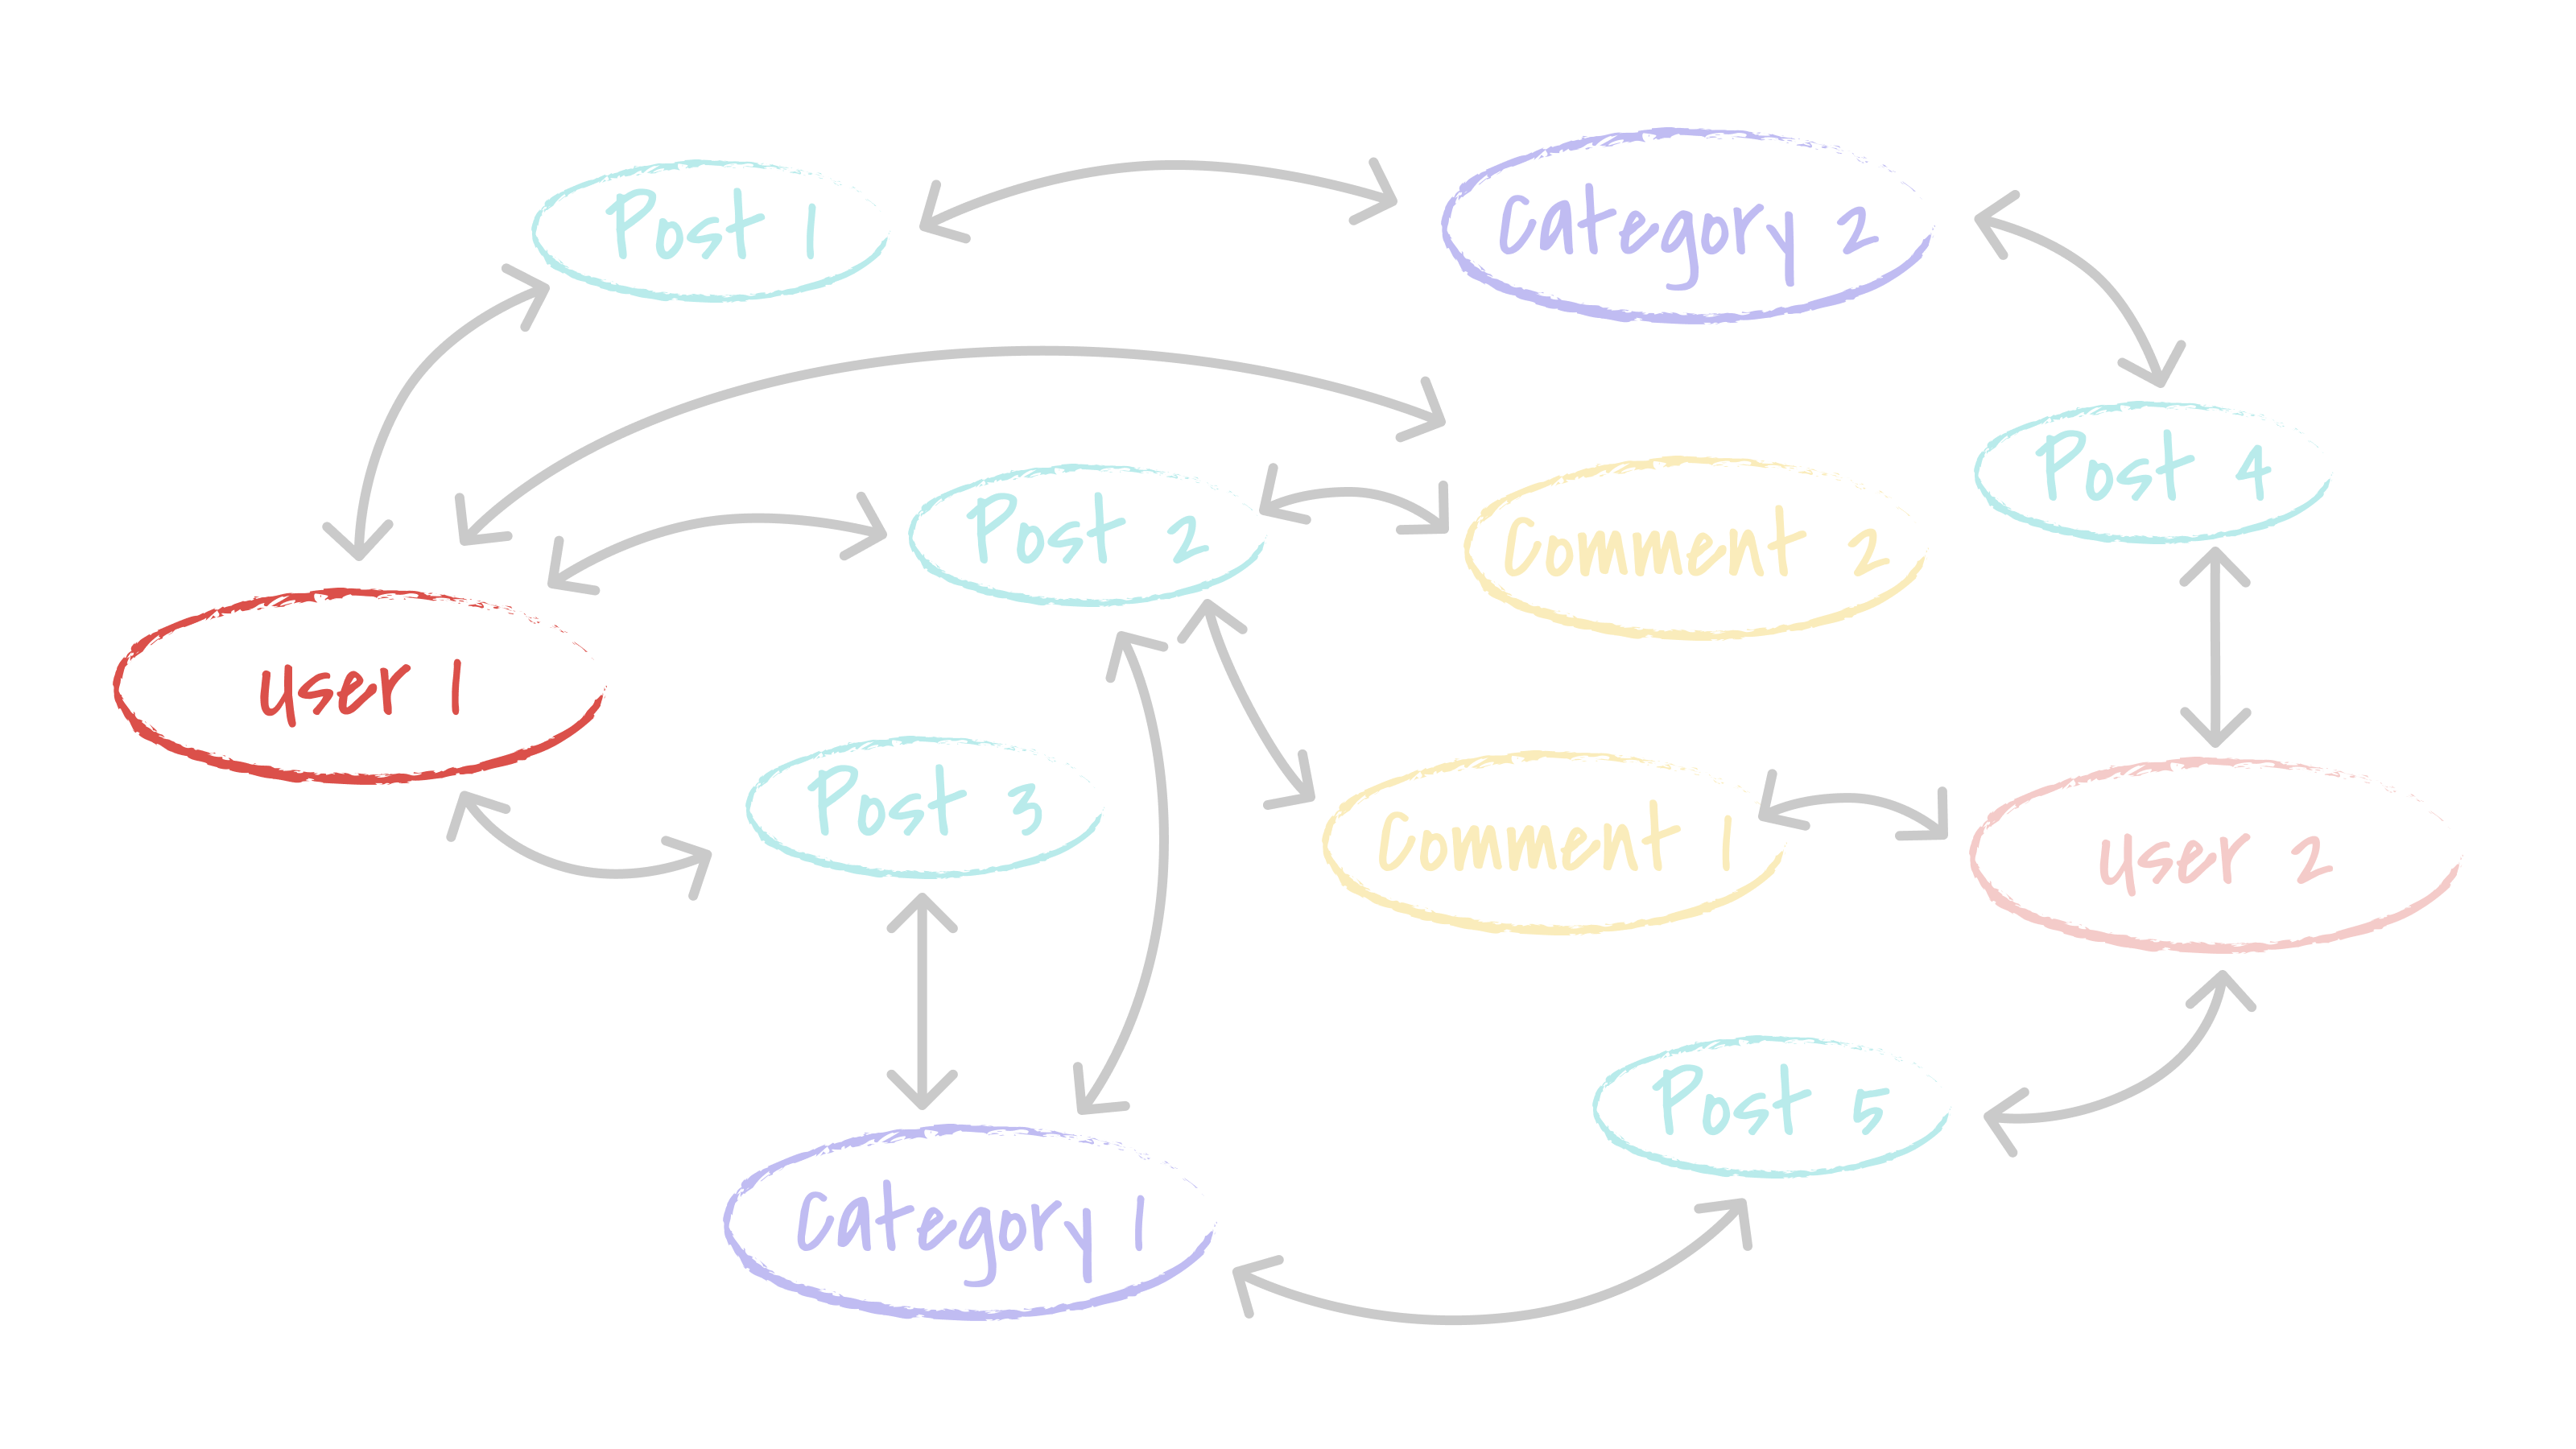
query a user
Often, though, even in just presenting a user’s information, you need to present information like most recent activity or sum up interest in recent posts. So it’s more likely that you’ll start by finding the user as an entry point and then traversing some edges in the graph to explore a subgraph of interesting data. That might look like this traversal, starting at the user and then following edges to their posts.
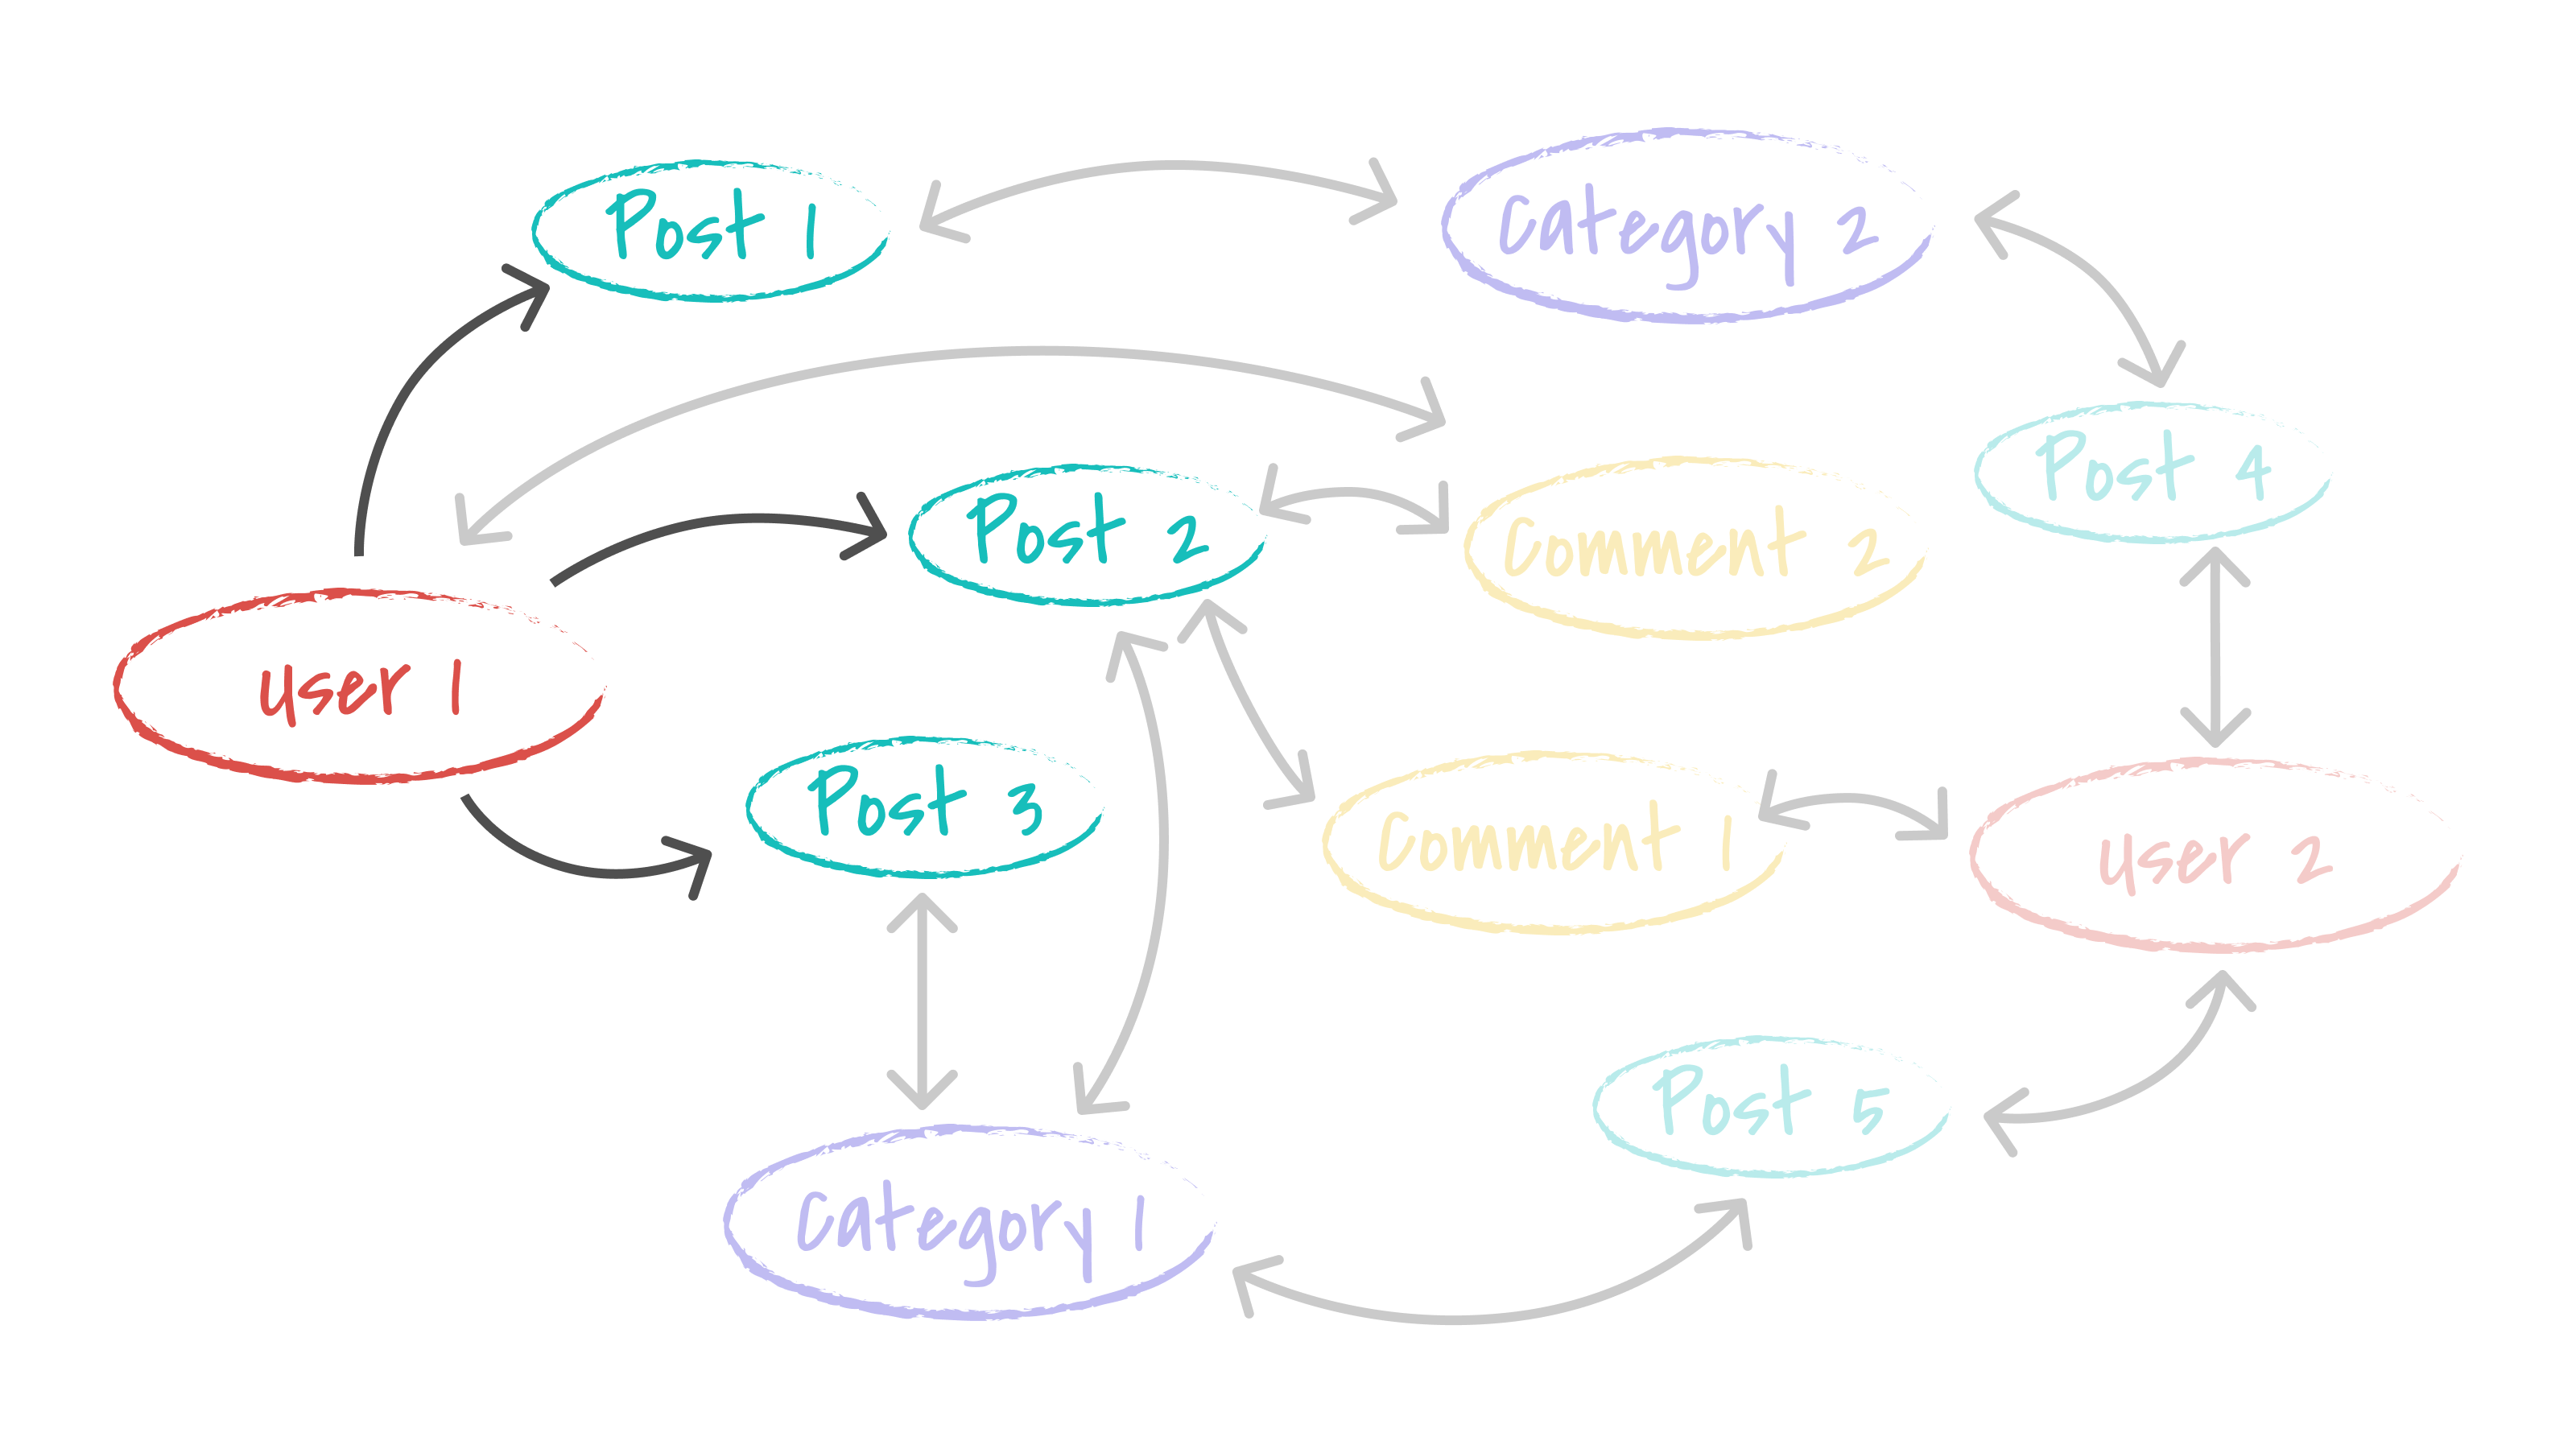
query a user and their posts
You can really start to see that traversal when it comes to rendering an individual post. You’ll need to find the post, probably by its id when a user navigates to a url like /post/0x2, then you’ll follow edges to the post’s author and category, but you’ll also need to follow the edges to all the comments, and from there to the authors of the comments. That’ll be a multi-step traversal like the following sketch.
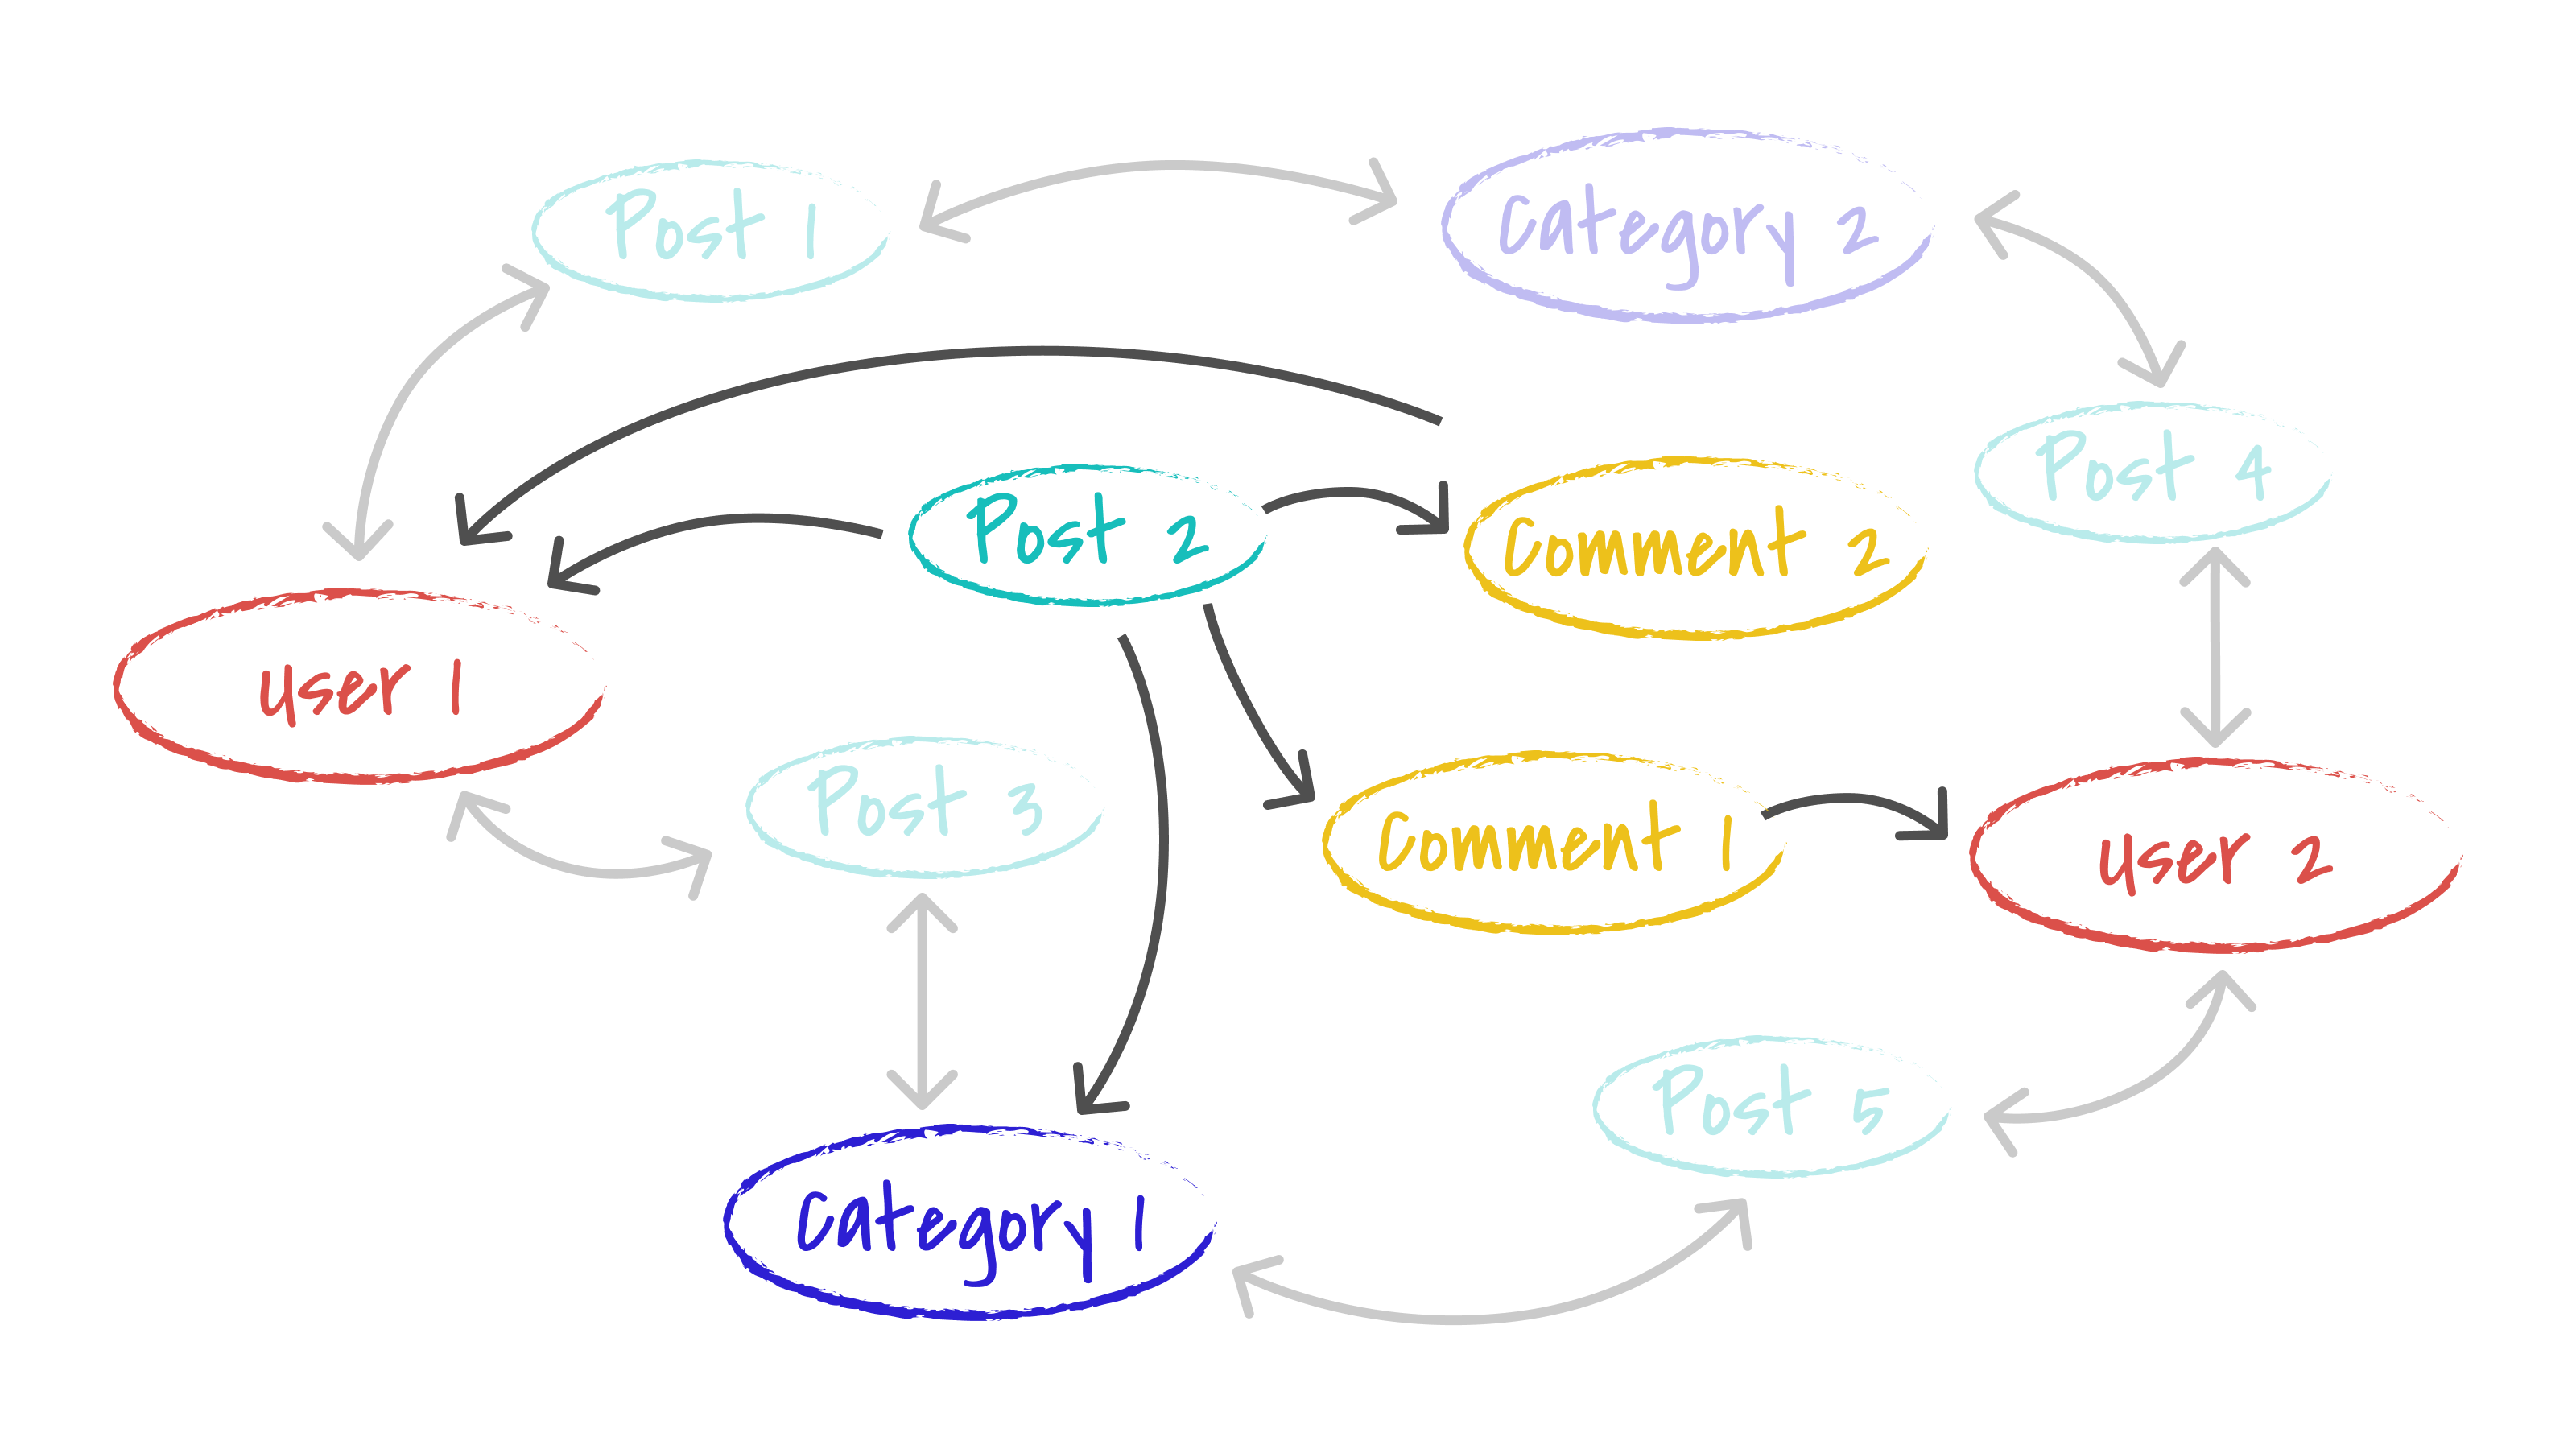
query a post and follow edges
Graphs make these kinds of data traversals really clear, as compared to table joins or navigating your way through a RESTful API. It can also really help to jot down a quick sketch.
It’s also possible for a query to have multiple entry points and traversals from all of those entry points. Imagine, for example, the query that renders the post list on the main page. That’s a query that finds multiple posts, maybe ordered by date or from particular categories, and then, for each, traverses to the author, category, etc.
You can now begin to see the GraphQL queries needed to fill out the UI. For example, in the sketch at the top, there will be a query starting at the logged in user to find their details, a query finding all the category nodes to fill out the category dropdown, and a more complex query that will find a number of posts and make traversals to find the posts' authors and categories.
Schema
Now that you have investigated and considered what you are going to show for posts and users, you can start to flesh out your schema some more.
Posts, for example, are going to need a title and some text for the post, both string valued. Posts will also need some sort of date to record when they were uploaded. They’ll also need links to the author, category and a list of comments.
The next iteration of your schema might look like this sketch.
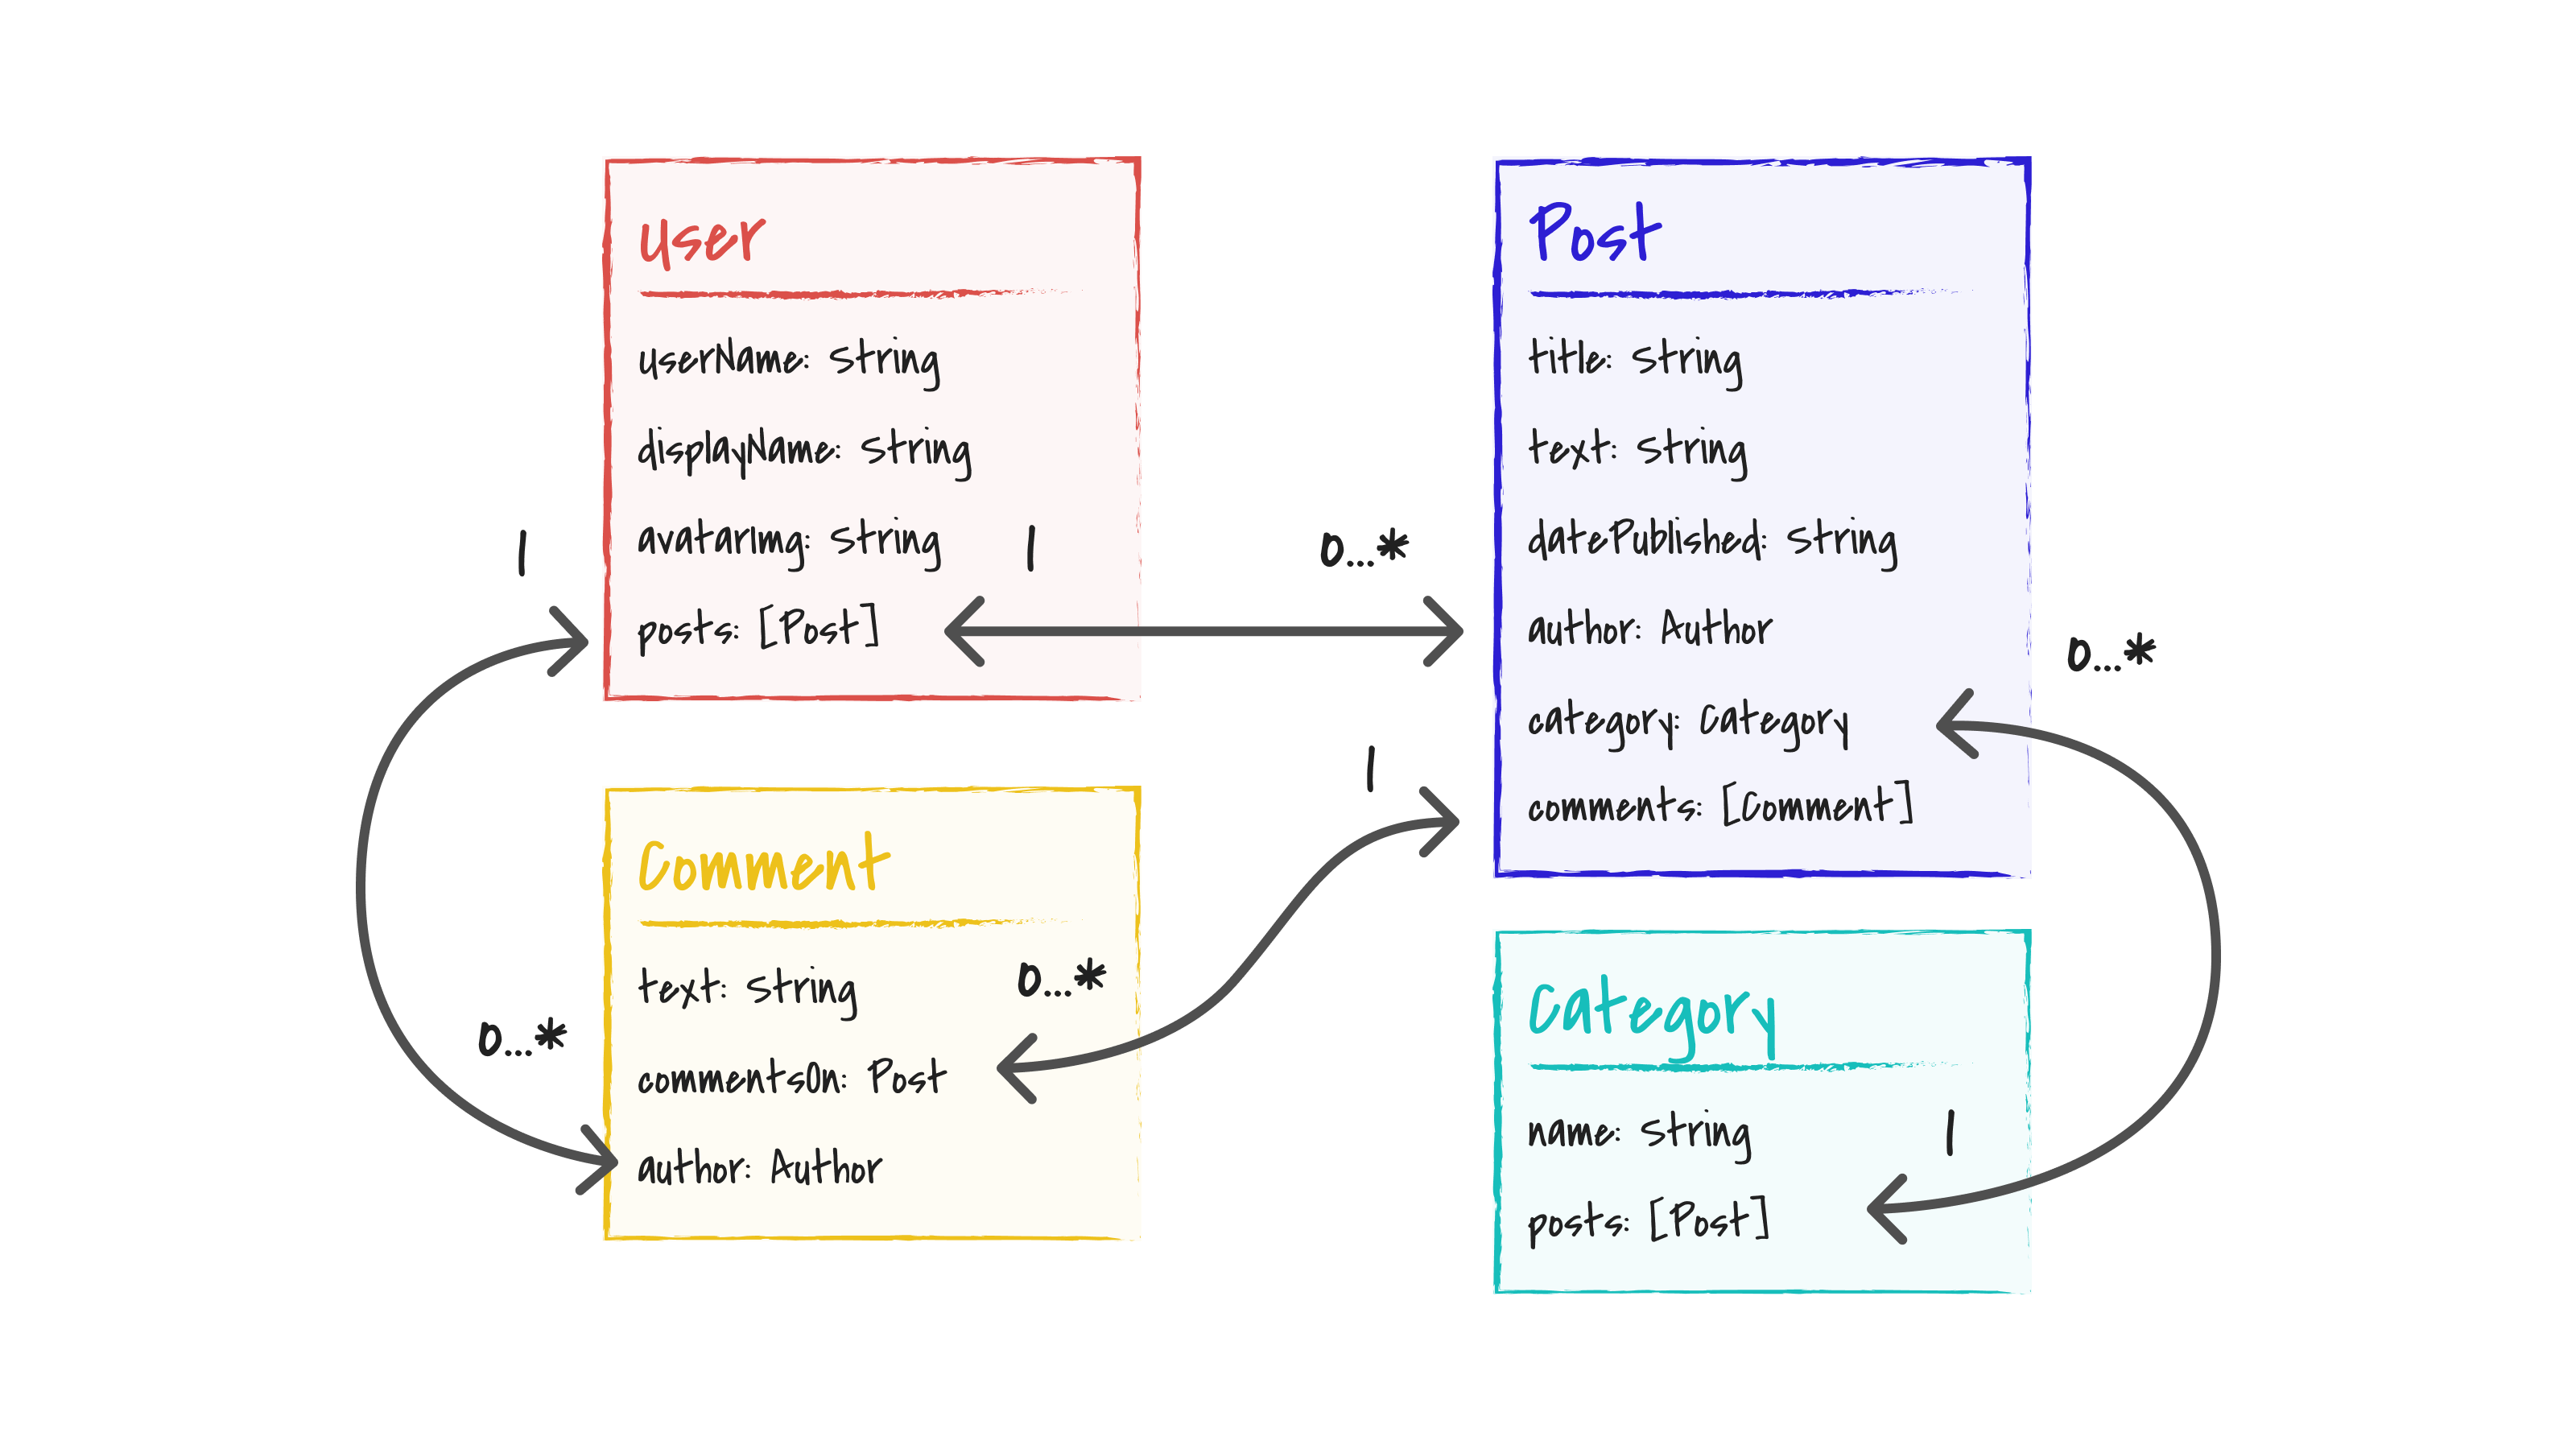
Graph schema sketch with data
That’s your first cut at a schema — the pattern your application data graph will follow.
You’ll keep iterating on this as you work through the tutorial, that’s what you’d do in building an app, no use pretending like you have all the answers at the start. Eventually, you’ll want to add likes and dislikes on the posts, maybe also tags, and you’ll also layer in a permissions system so some categories will require permissions to view. But, those topics are for later sections in the tutorial. This is enough to start building with.
What’s next
Next you’ll make your design concrete, by writing it down as a GraphQL schema, and upload that to Dgraph Cloud. That’ll give you a running GraphQL API and you’ll look at the queries and mutations that will form the data of your app.